
2026 Results: tested October 22, 2026
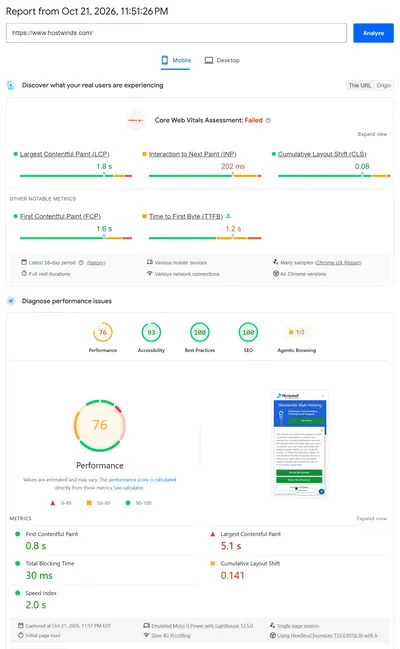
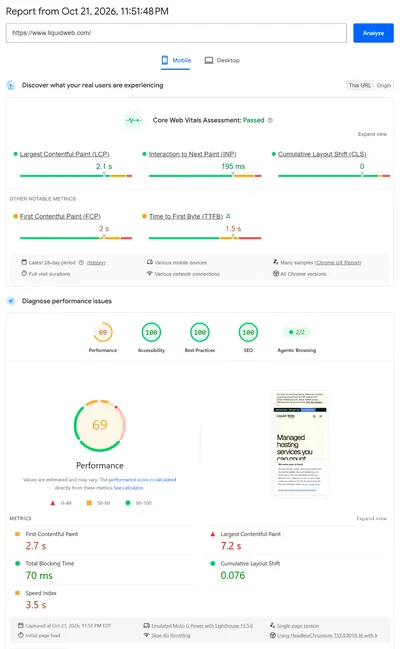
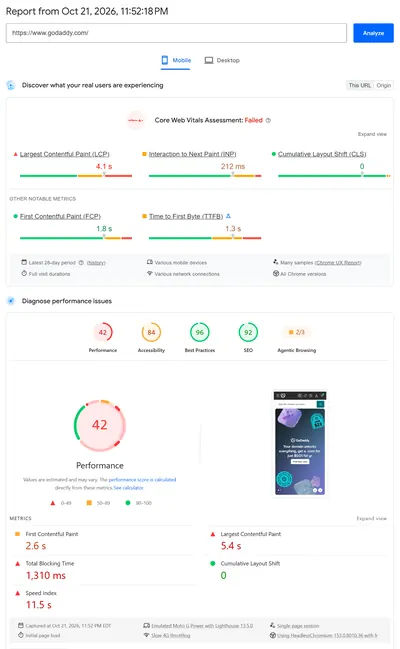
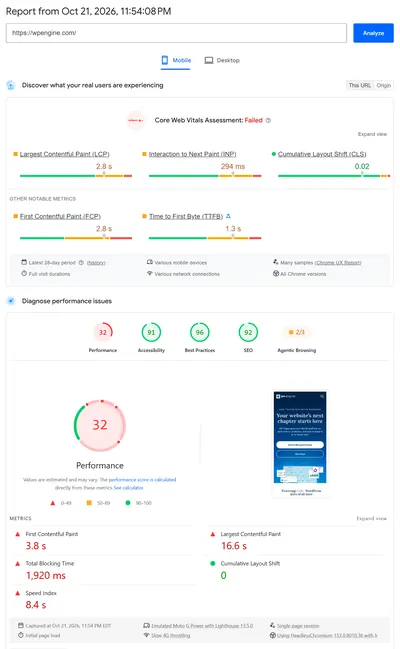
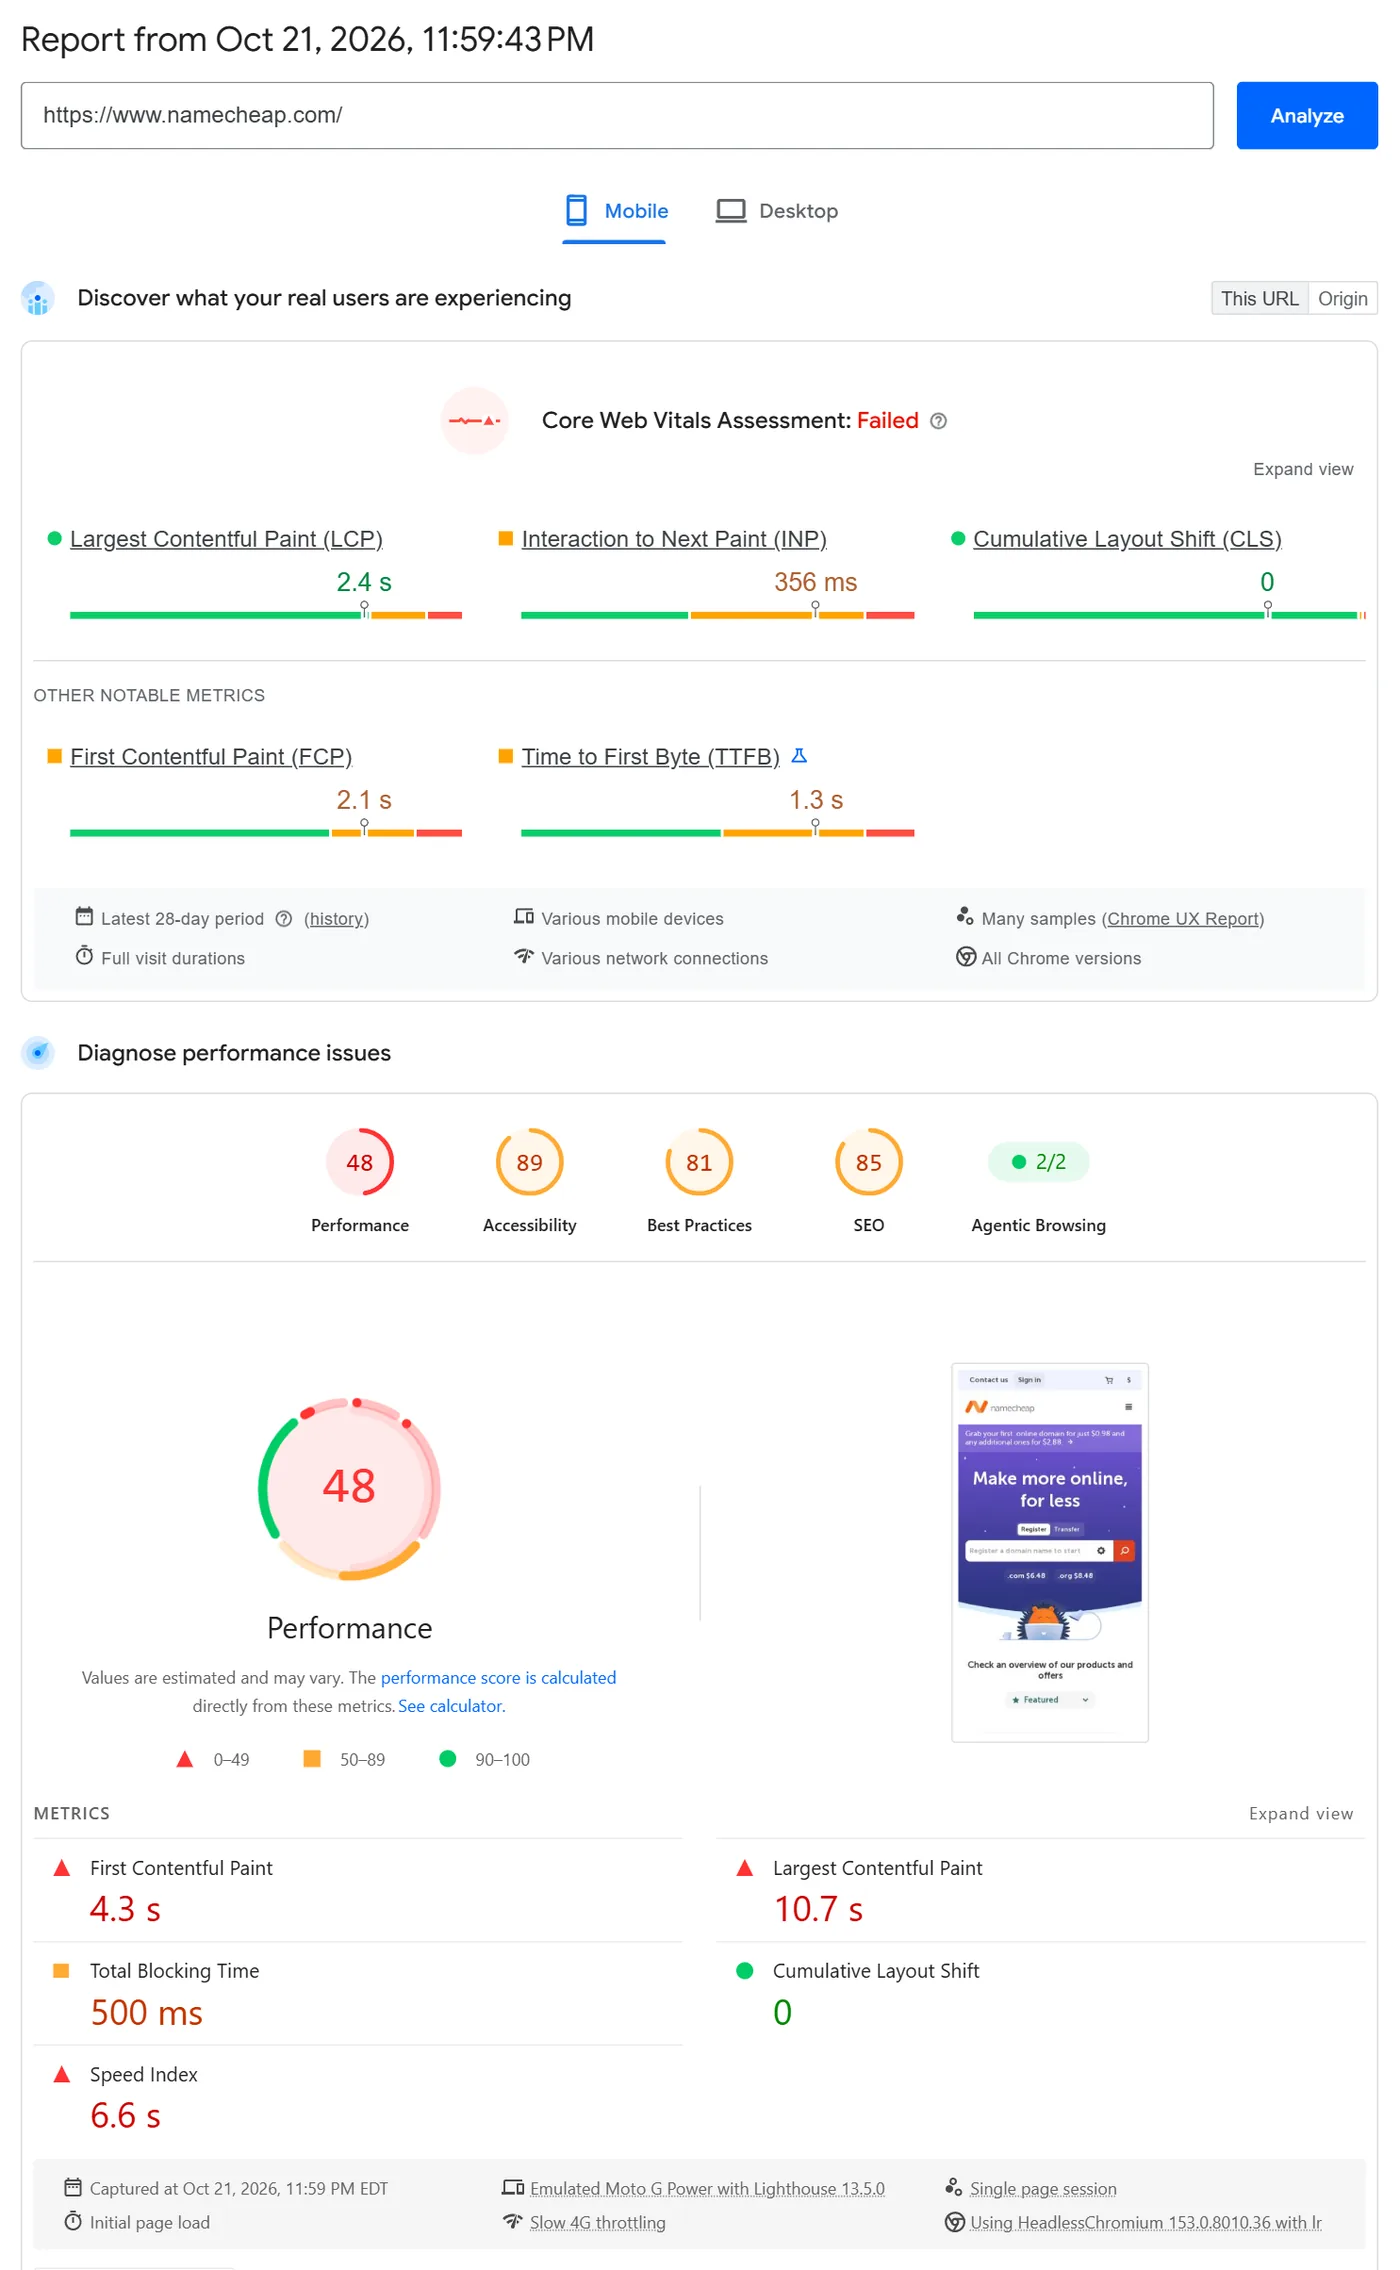
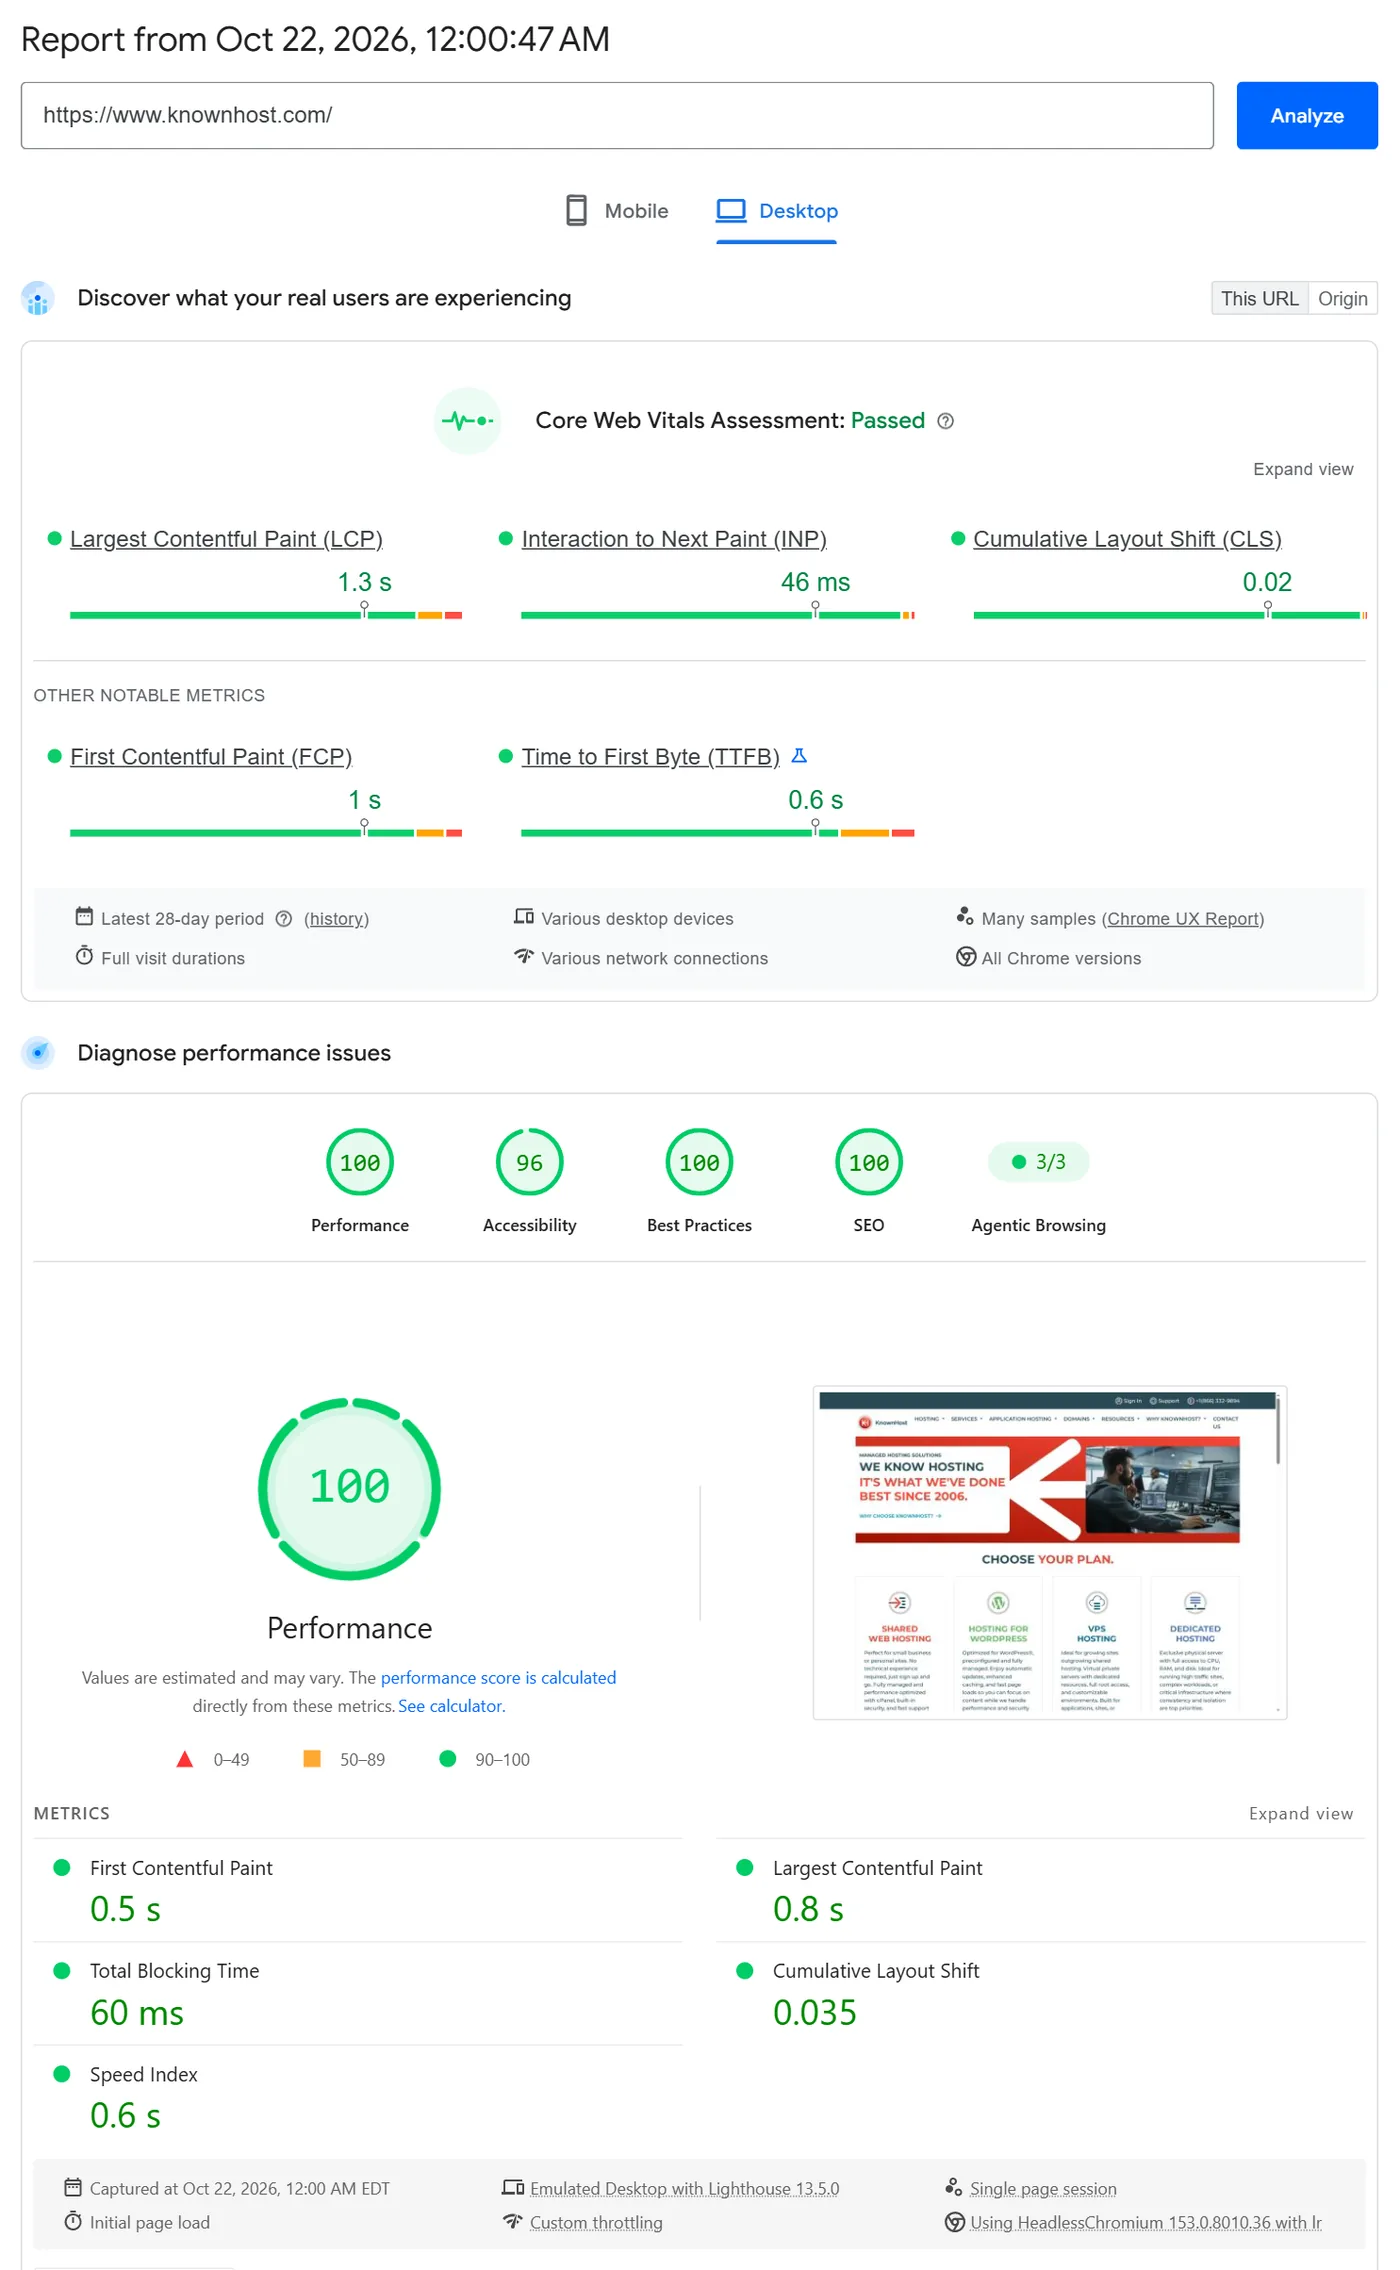
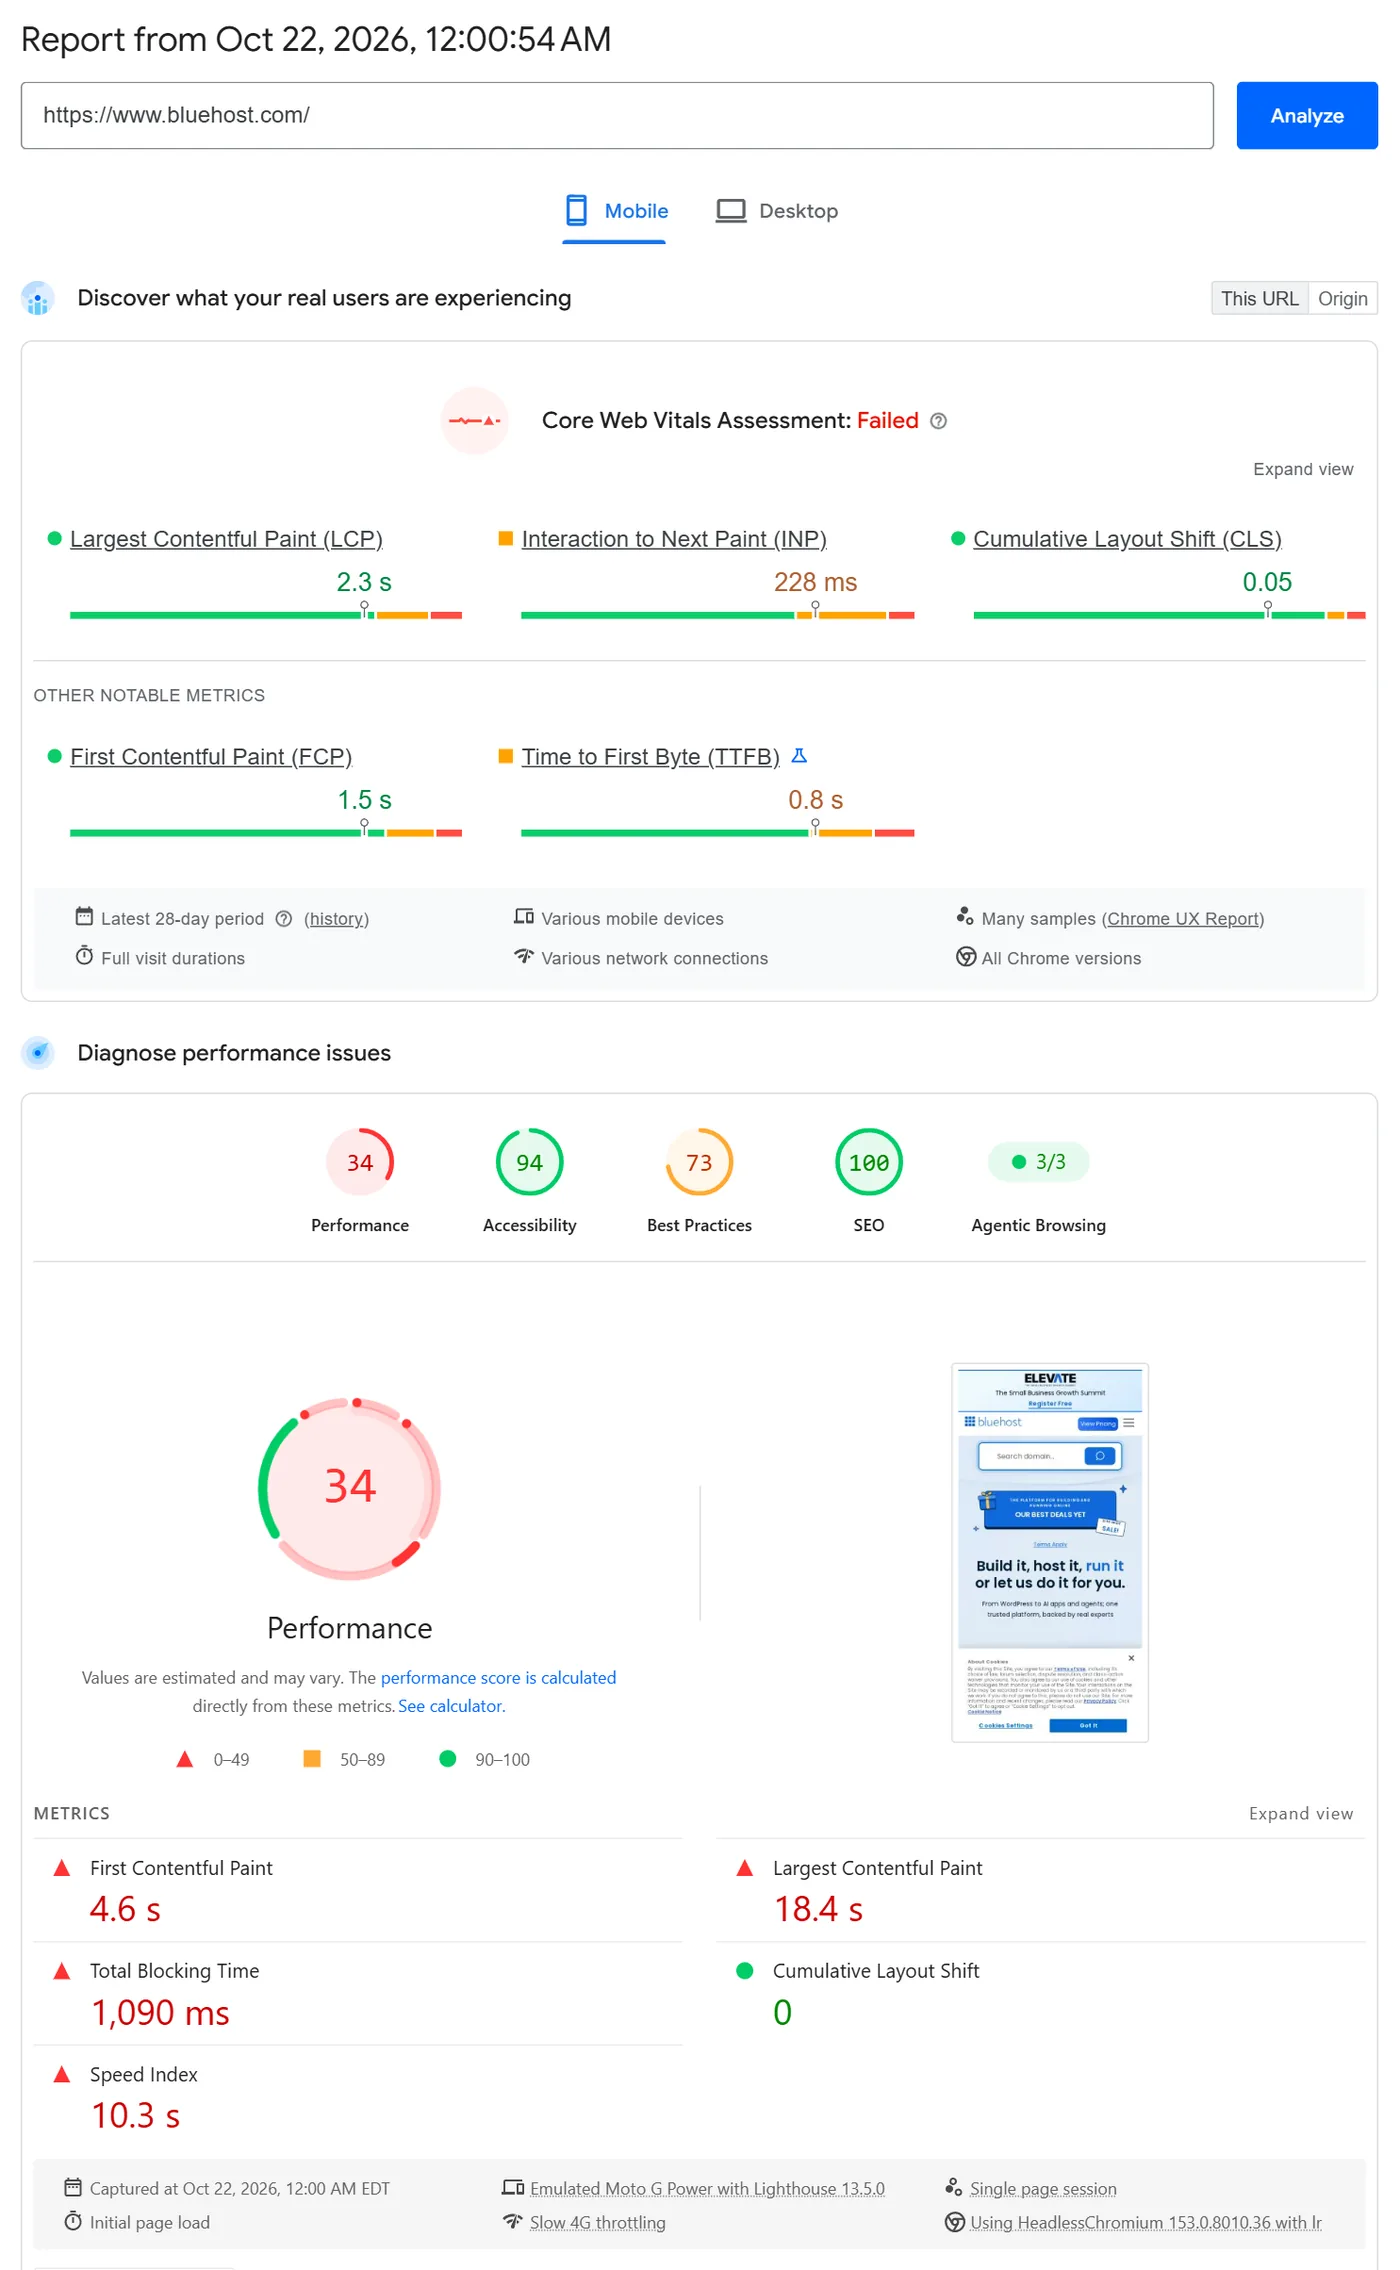
Results from Google PageSpeed Insights (pagespeed.web.dev) for each company’s own home page, exactly as Google reported them, with a screenshot of every report below. Agentic Browsing is shown as Google shows it, as checks passed. Overall is our own average of that report’s five results (checks passed counted as a percentage). Equal scores are ordered by the other device’s score.
| Instant Access | Other 14 hosts, average | |||
|---|---|---|---|---|
| Mobile | Desktop | Mobile | Desktop | |
| Performance | 100 | 100 | 54 | 79 |
| Accessibility | 100 | 100 | 91 | 92 |
| Best Practices | 100 | 100 | 93 | 93 |
| SEO | 100 | 100 | 94 | 94 |
| Agentic Browsing | 3/3checks passed | 3/3checks passed | 75%of checks passed | 77%of checks passed |
| Overall (our average) | 100 | 100 | 81 | 87 |
Performance: how fast the page loads and becomes usable (load speed, responsiveness, visual stability).
Every host, every category
One chart per host, from its Google report pictured below. Agentic Browsing is shown as checks passed, as Google shows it; its bar is the share passed.
- Performance
- Accessibility
- Best Practices
- SEO
- Agentic Browsing
Mobile
Desktop
Mobile
Desktop
Mobile
Desktop
Mobile
Desktop
Mobile
Desktop
Mobile
Desktop
Mobile
Desktop
Mobile
Desktop
Mobile
Desktop
Mobile
Desktop
Mobile
Desktop
Mobile
Desktop
Mobile
Desktop
Mobile
Desktop
Mobile
Desktop
Google’s own reports
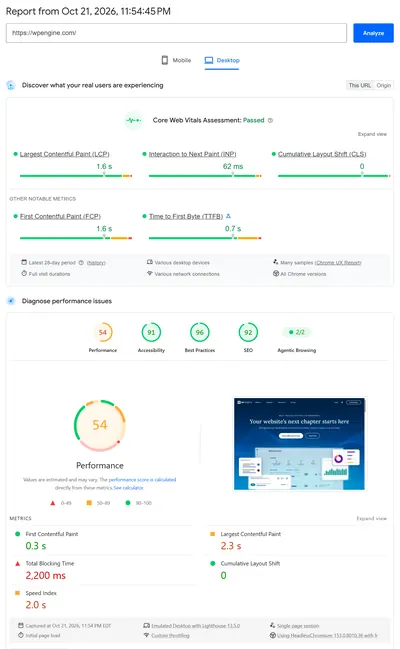
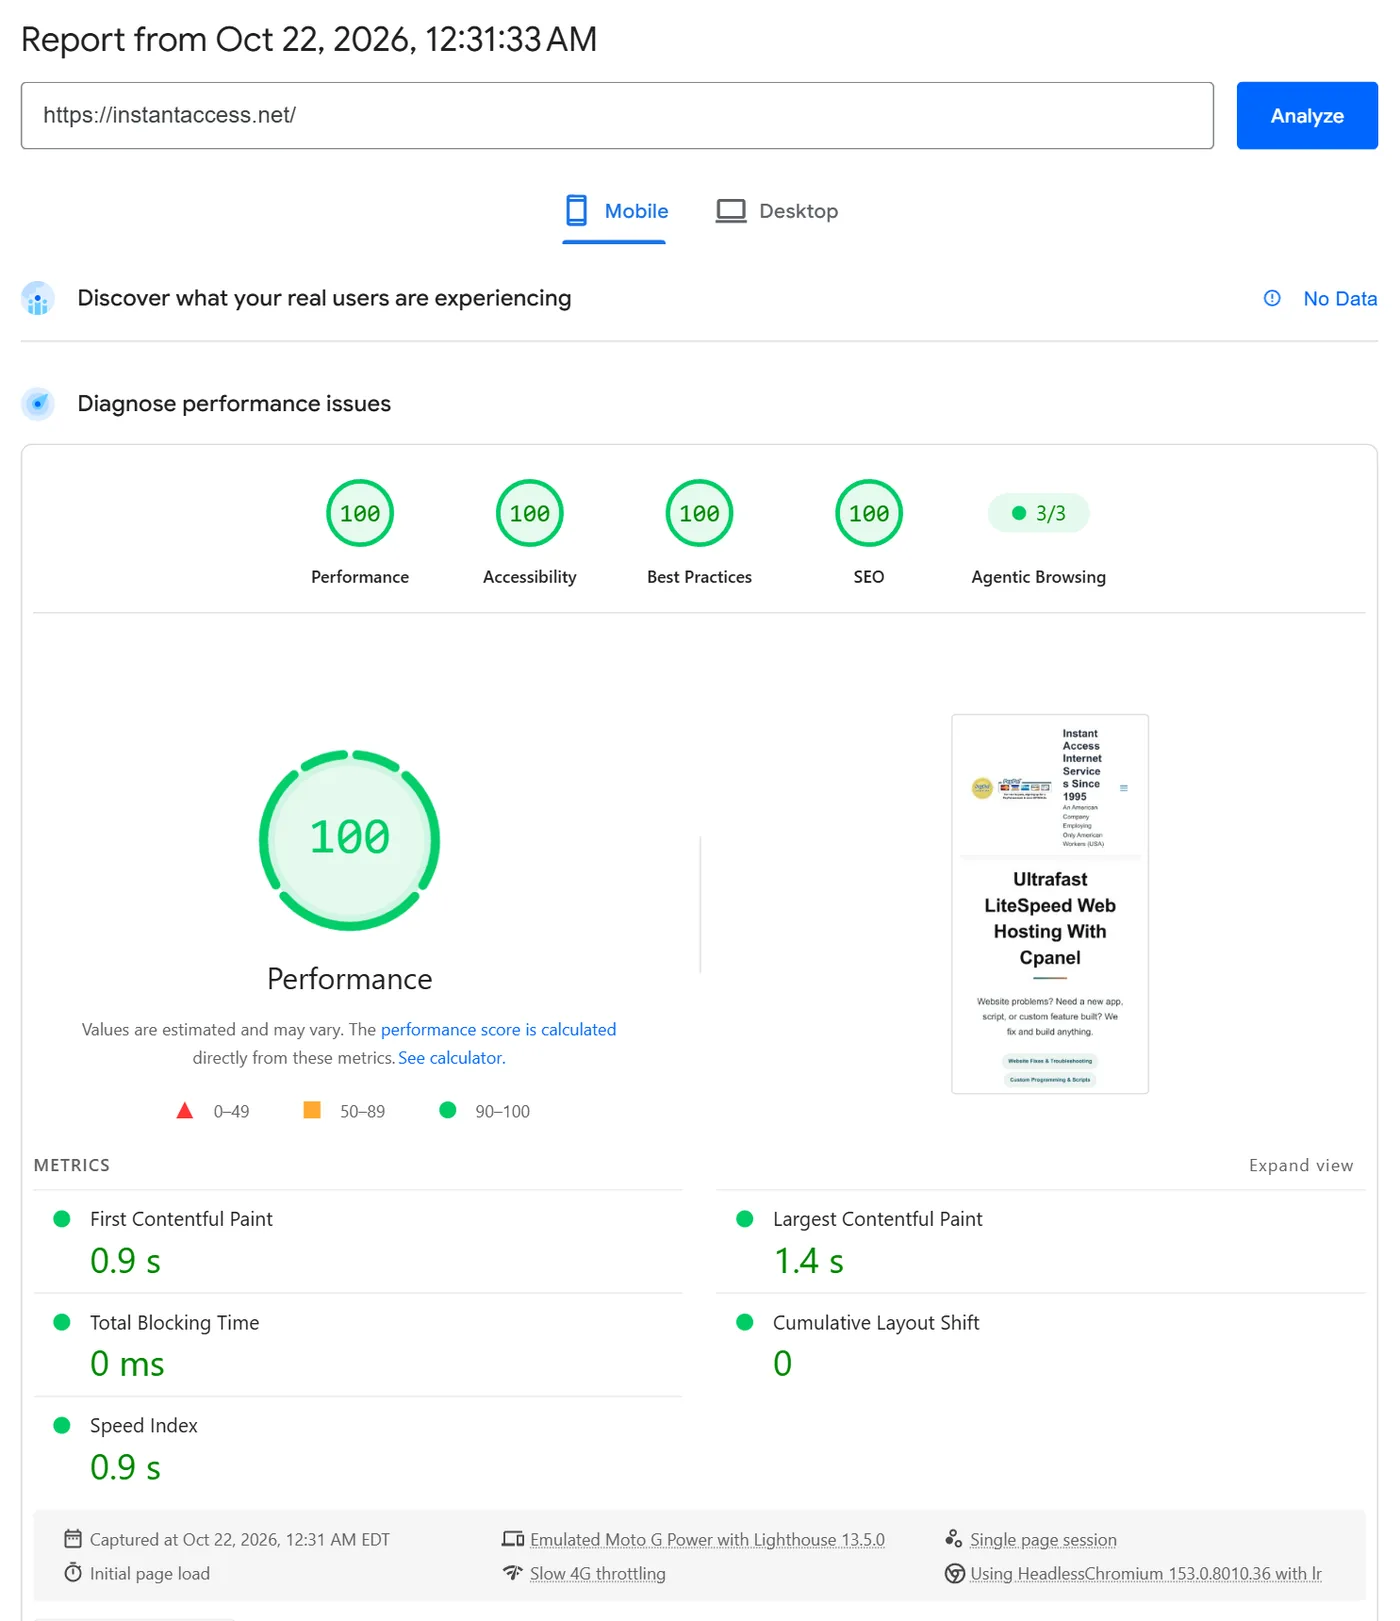
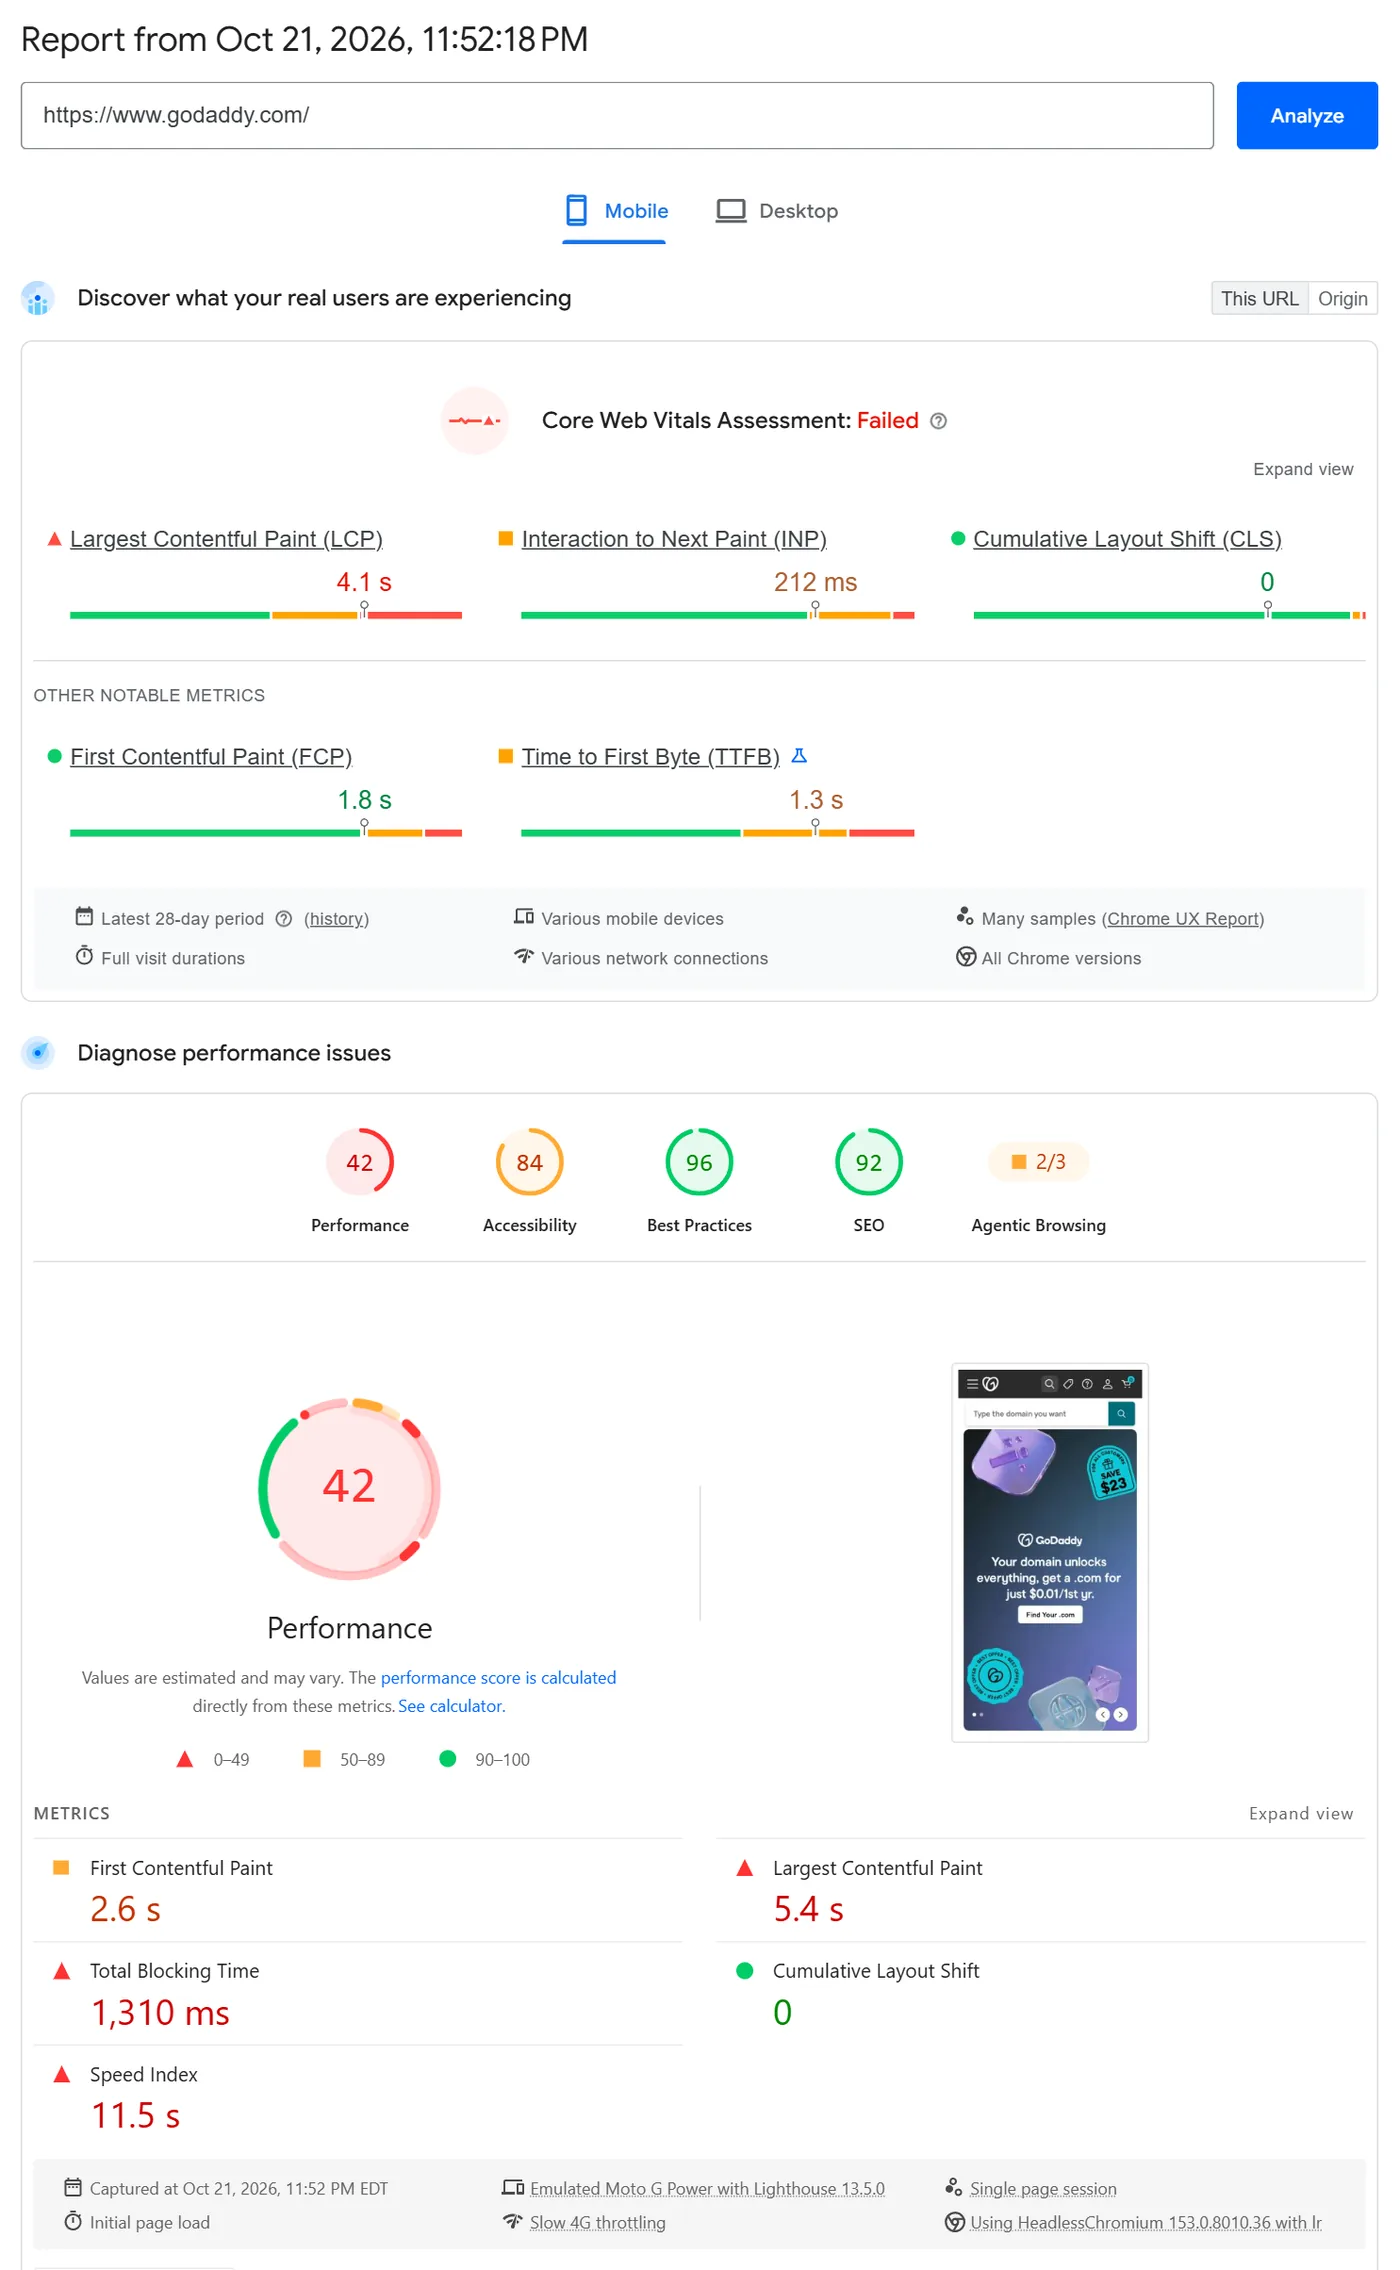
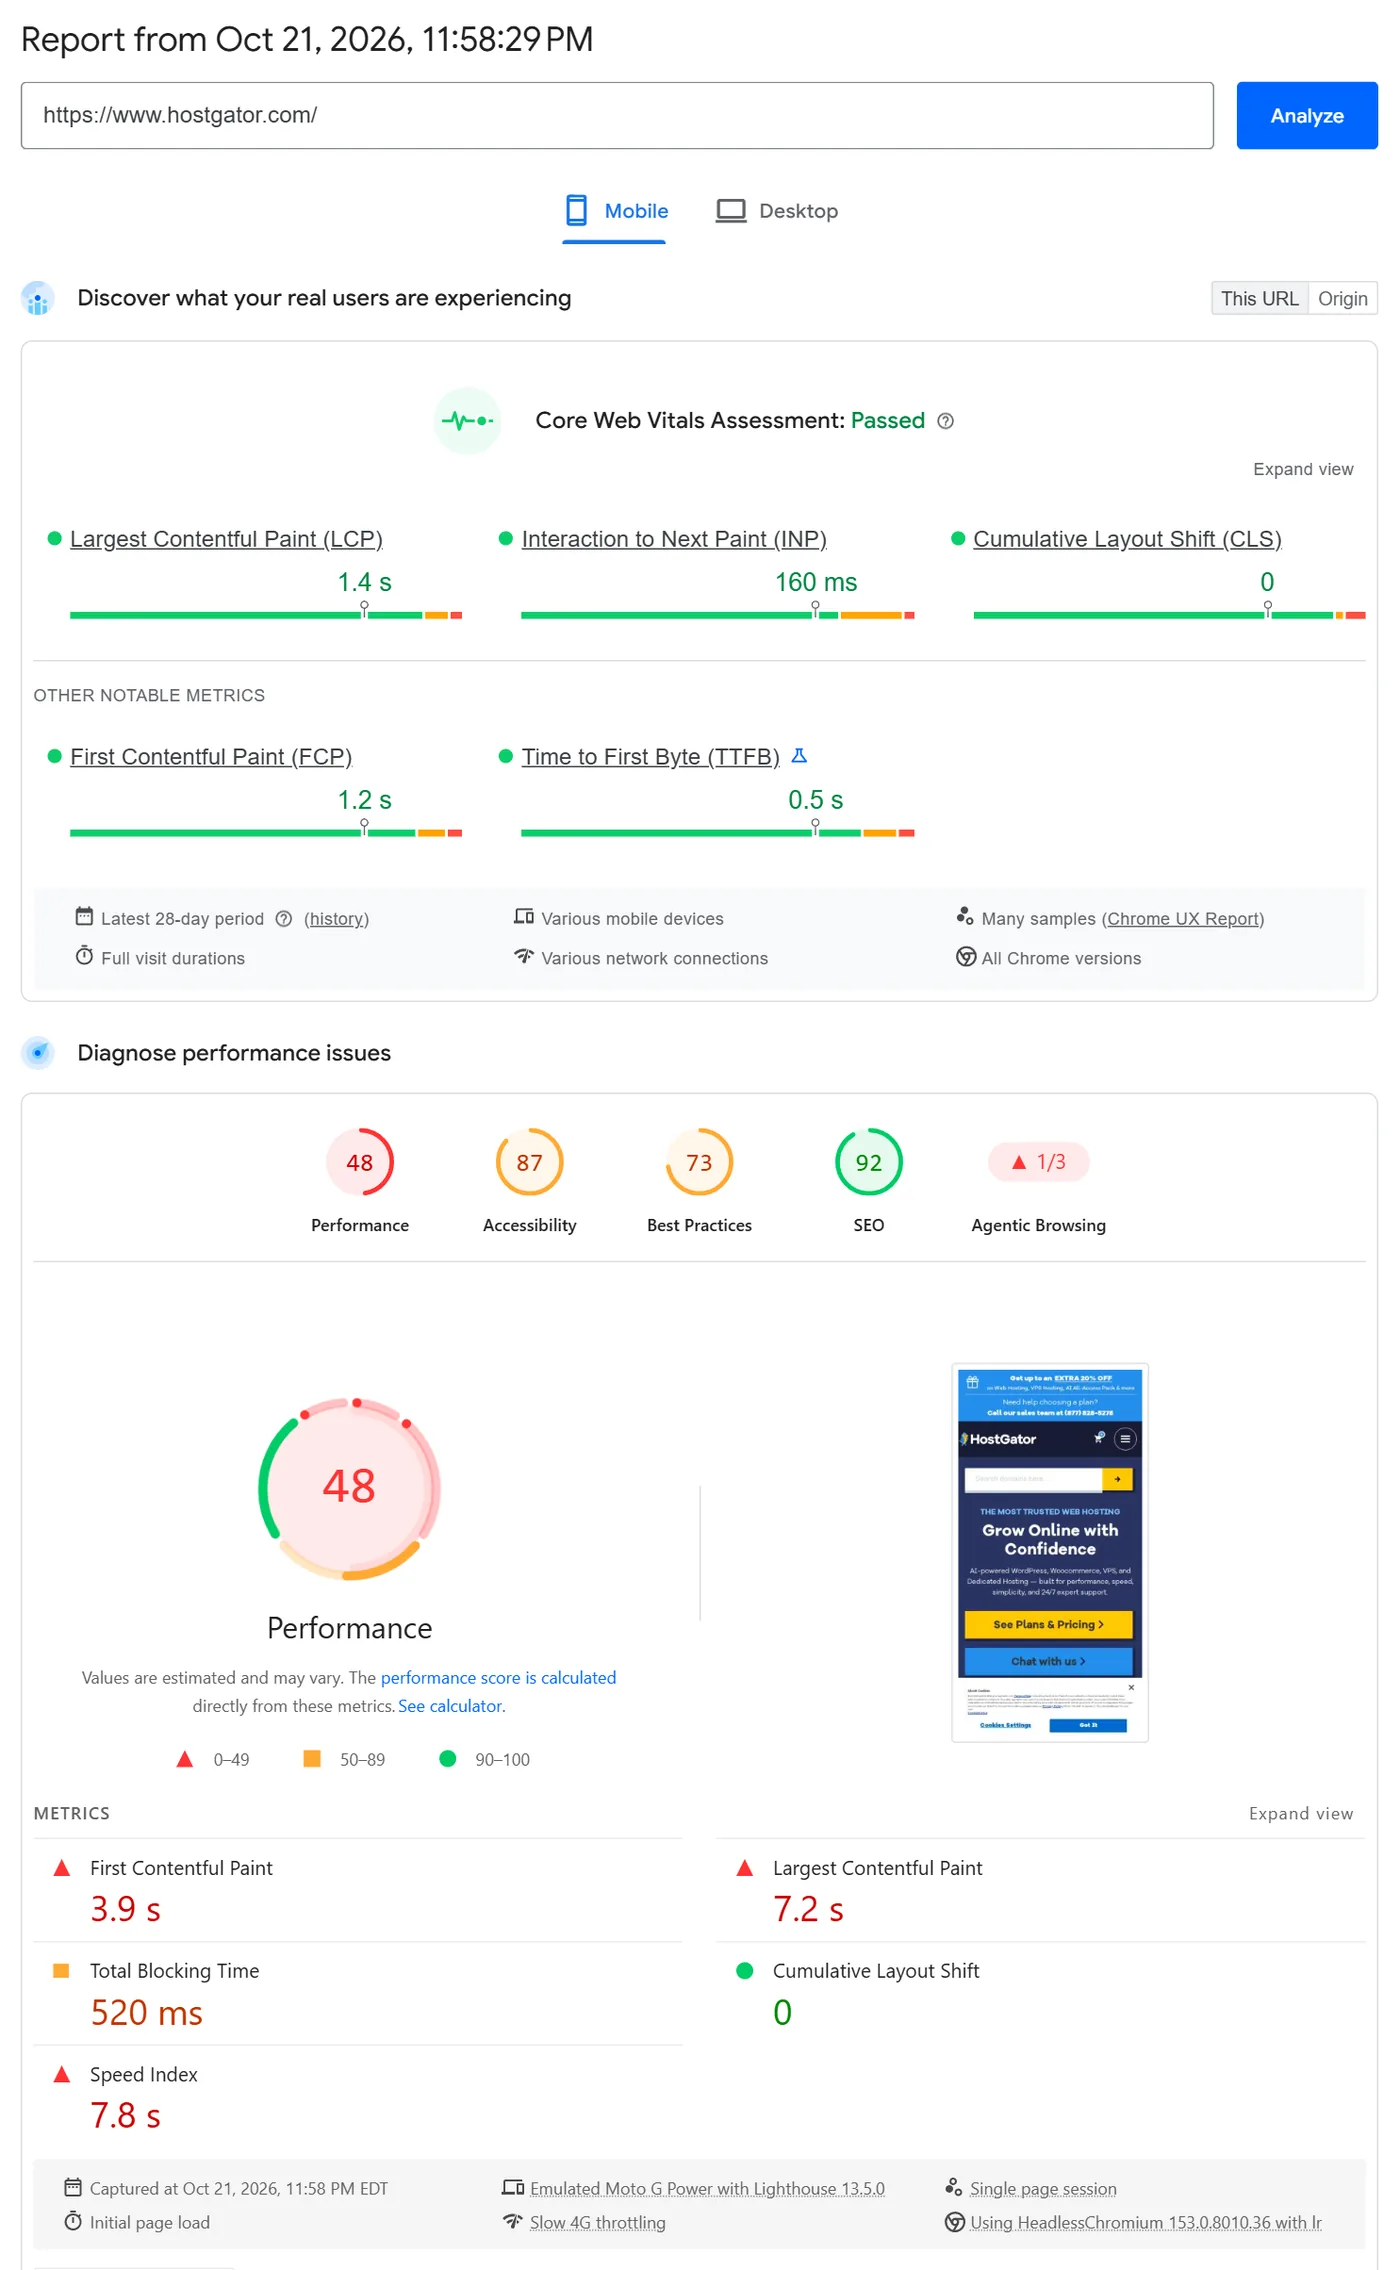
Screenshots of Google PageSpeed Insights results for every host, mobile and desktop. Click one to see it full size; each links to Google’s saved report so you can check it yourself. Every number in the charts above comes from these exact reports.

















Run the test yourself
Pick a host, or enter any web address, and Google’s PageSpeed Insights tests it live in a new tab. Then test Instant Access the same way and compare.
Or see live results right here
Google tests the host you pick and Instant Access at the same moment, in all five categories, and the results appear below.
Then compare: test Instant Access on mobile · on desktop
How performance changed: 2021, 2024 and 2026 (mobile)
Our 2021 and 2024 tests measured performance only, so this comparison is performance only.
- 2021
- 2024
- 2026
- Instant Access
- Hostwinds
- Liquid Web
- GoDaddy
- AccuWeb Hosting
- WP Engine
- A2 Hosting
- InMotion Hosting
- IONOS
- DreamHost
- HostGator
- Namecheap
- KnownHost
- Bluehost
- SiteGround
All numbers in a table, with links to test each site yourself
| Company | 2026 mobile | 2026 desktop | Performance, earlier | Test it now | |||||||||
|---|---|---|---|---|---|---|---|---|---|---|---|---|---|
| Performance | Accessibility | Best Practices | SEO | Agentic Browsing | Performance | Accessibility | Best Practices | SEO | Agentic Browsing | 2021 | 2024 | ||
| Instant Access | 100 | 100 | 100 | 100 | 3/3 | 100 | 100 | 100 | 100 | 3/3 | 100 | 100 | mobile · desktop |
| Hostwinds | 76 | 93 | 100 | 100 | 1/2 | 100 | 93 | 100 | 100 | 2/2 | 75 | 92 | mobile · desktop |
| Liquid Web | 69 | 100 | 100 | 100 | 2/2 | 95 | 100 | 100 | 100 | 1/3 | 65 | 60 | mobile · desktop |
| GoDaddy | 42 | 84 | 96 | 92 | 2/3 | 55 | 92 | 96 | 92 | 2/3 | 58 | — | mobile · desktop |
| AccuWeb Hosting | 55 | 94 | 96 | 92 | 3/3 | 67 | 89 | 96 | 100 | 2/3 | 54 | 58 | mobile · desktop |
| WP Engine | 32 | 91 | 96 | 92 | 2/3 | 54 | 91 | 96 | 92 | 2/2 | 36 | 34 | mobile · desktop |
| A2 Hosting | 53 | 85 | 96 | 100 | 2/3 | 88 | 85 | 96 | 100 | 2/3 | 34 | 58 | mobile · desktop |
| InMotion Hosting | 51 | 90 | 92 | 92 | 2/3 | 80 | 93 | 96 | 92 | 2/3 | 28 | 38 | mobile · desktop |
| IONOS | 36 | 83 | 96 | 92 | 0/2 | 70 | 88 | 96 | 92 | 1/2 | 25 | 36 | mobile · desktop |
| DreamHost | 55 | 94 | 100 | 92 | 3/3 | 88 | 94 | 100 | 92 | 3/3 | 25 | — | mobile · desktop |
| HostGator | 48 | 87 | 73 | 92 | 1/3 | 61 | 87 | 73 | 92 | 1/3 | 22 | — | mobile · desktop |
| Namecheap | 48 | 89 | 81 | 85 | 2/2 | 81 | 91 | 81 | 85 | 2/2 | — | 54 | mobile · desktop |
| KnownHost | 96 | 96 | 100 | 100 | 3/3 | 100 | 96 | 100 | 100 | 3/3 | — | 77 | mobile · desktop |
| Bluehost | 34 | 94 | 73 | 100 | 3/3 | 70 | 91 | 73 | 100 | 3/3 | — | 28 | mobile · desktop |
| SiteGround | 60 | 97 | 100 | 85 | 3/3 | 93 | 97 | 100 | 85 | 3/3 | — | 57 | mobile · desktop |
How we tested: each company’s home page, tested October 22, 2026 on Google PageSpeed Insights (pagespeed.web.dev, Lighthouse 13.5.0) using its standard mobile and desktop tests. Every number shown is from the Google report pictured for that host and device. Overall is our average of that report’s results. 2021 and 2024 performance scores come from PageSpeed Insights and are shown as published in our earlier charts. Agentic Browsing is a new Lighthouse category that Google says is still under development. Scores vary from run to run and by test location; the links let you run Google’s test yourself. Earlier results (2021 and 2024).
Based on PC Magazine’s list of
The Best Web Hosting Services
According to PC Magazine, the best web hosting companies are…
- HostGator
- A2 Hosting
- Accu Web Hosting
- DreamHost
- Hostwinds
- Liquid Web
- 1&1 Ionos Web Hosting
- WPEngine
- GoDaddy
- Immotion Hosting
By Customer Request! We are including these metrics too:
Where’s Instant Access? We have always had enough business without advertising, and with more than 25 years in service, quietly serving the needs of highly-selective customers, Instant Access is the sleeper that blows away the muscle cars on the track. Want proof?
No need to take our word for it, compare speeds using the gold standard, Google’s Page Speed Insights, a 3rd party testing tool used and accepted by the world.
Test for yourself with the live tool above, or by clicking on the list above. Don’t forget to test Instant Access and compare!
Spoiler! After our live test, the results are in.
Instant Access continues to be the standard!